
Mapping Demographics
Jayme Bosio decided to use mapping to see who Palm Beach County Library System’s patrons were and which patrons the library system wasn’t reaching. The government research services librarian got the idea from attending the South Florida GIS Expo in October 2014.
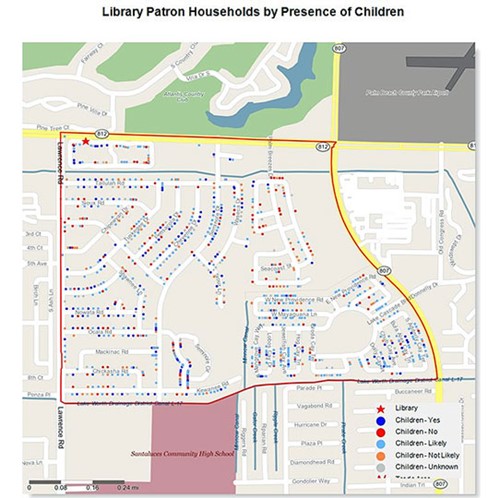
“We can always create tables and spreadsheets for a lot of this information, but I felt a map provides another layer of analysis that could help us tailor services and outreach at each of our 17 locations,” Bosio says.
She faced several challenges with the project, most importantly a lack of knowledge about mapping.
In hindsight, she feels that she should have first determined specifically what she wanted to know about the library’s users. “That misstep was a major setback.”
Ultimately, she decided to use Analytics on Demand for her mapping project. AOD had several advantages:
- Relatively inexpensive
- ILS addresses imported fairly easily
- Little to no training needed
- Useful report information, including:
- Income level
- Household composition
- Years of residence
- Marketing segmentation based on psychographics (attitudes, consumer behaviors, etc.)
“I think this information has helped develop a greater understanding of how diverse our community is and hopefully will help us to tailor our services to each branch’s needs,” Bosio says.